Choose Cell Lines for Thyroid Cancer Research: Harvard Sander Lab
FTC-133, 8505C, CAL-62, 8305C, and BHT-101 are some of the most widely used cell lines for thyroid cancer research. Often researchers have questions on selecting the most appropriate cell line(s) for particular research uses.
TumorComparer utilizes several data types (e.g., mutation, copy number, and expression) to perform a comparison of The Cancer Genome Atlas (TCGA) tumor data to experimental cell line models from the Cancer COSMIC Cell Line Project (CCLP) for several cancer types. Please refer to Sinha R et al., 2021. DOI: 10.1016/j.crmeth.2021.100039 for details on the methodology.
An analysis for thyroid cancer cell lines with differences between the thyroid cancer cell lines FTC-133 vs 8505C; FTC-133 vs CAL-62; FTC-133 vs 8305C; and etc.
If you use content from this page, please cite Sinha R et al., 2021. DOI: 10.1016/j.crmeth.2021.100039.
Characteristics of Thyroid Cancer Cell Lines
The figure shows the presence of alterations for genes (TP53, KRAS, TSHR, MTOR, BRAF, etc.) commonly associated with thyroid cancer in the cell lines: TT2609C02, CAL62, CGTHW1, FTC133, BHT101, etc. The gene list is retrieved from DisGeNET, and the alteration information is retrieved from cBioPortal for the Cancer Cell Line Encyclopedia (CCLE) dataset.
NOTE: Only a subset of thyroid cancer cell lines are shown to ensure a readable figure. Alterations for additional thyroid cancer cell lines and genes are available on cBioPortal using links on the table below.
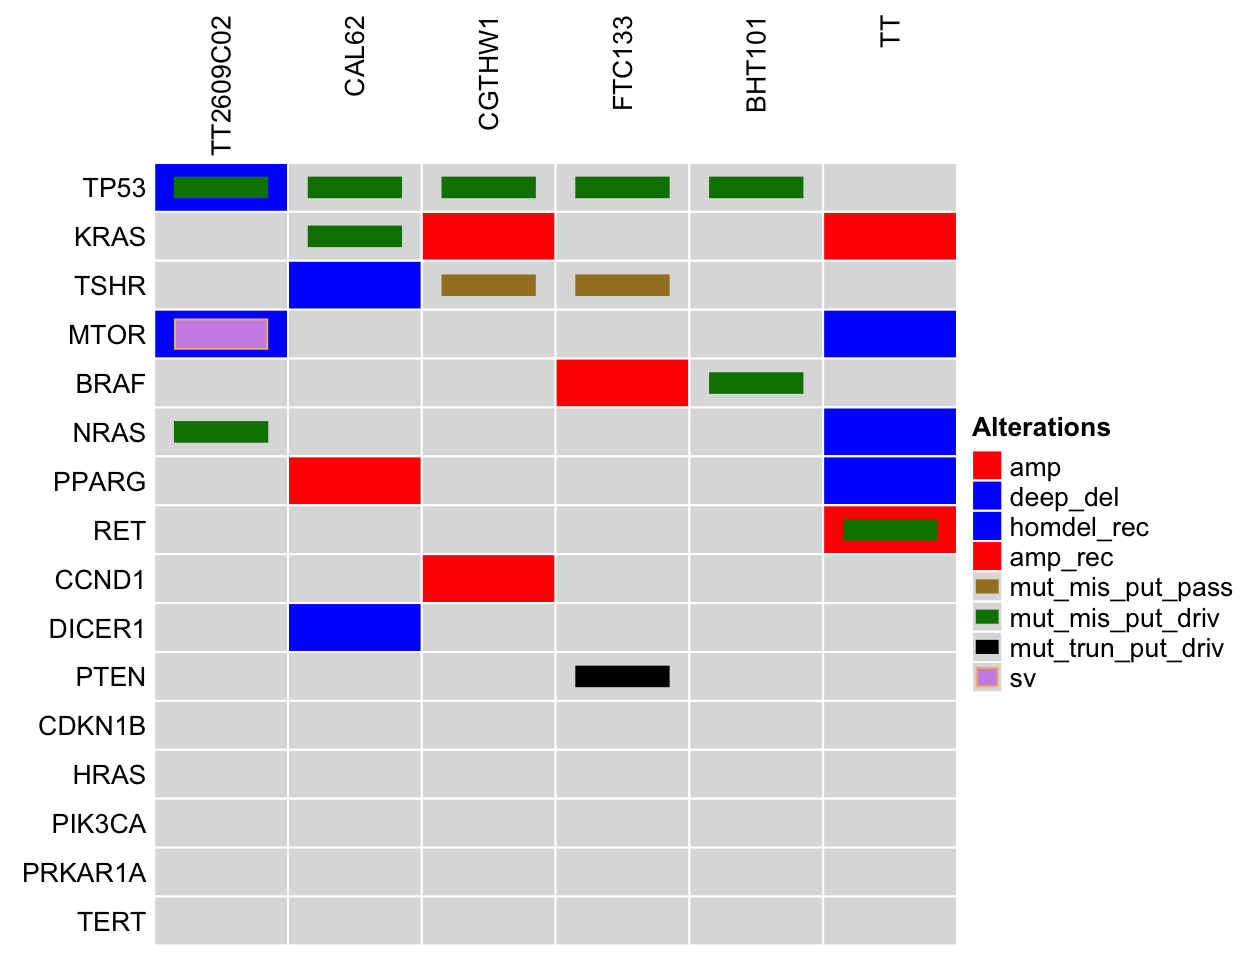
Comparing thyroid cancer cell lines to tumor samples. Legend Abbreviations: mrna_hi = mRNA High; mrna_lo = mRNA Low; prot_hi = Protein High; prot_lo = Protein Low; mut_mis_put_pass = Missense Mutation (putative passenger); mut_mis_put_driv = Missense Mutation (putative driver); mut_inframe_put_pass = Inframe Mutation (putative passenger); mut_inframe_put_driv = Inframe Mutation (putative driver); mut_trun_put_pass = Truncating mutation (putative passenger); mut_trun_put_driv = Truncating mutation (putative driver); amp = Amplification; deep_del = Deep Deletion; homdel_rec = homdel_rec; amp_rec = amp_rec; sv = sv; sv_rec = sv_rec; splice = splice
List of Thyroid Cancer Cell Lines Compared to Pan-Cancer TCGA
The TumorComparer analysis examines the most variably expressed genes, as well as alteration information for cell lines and TCGA patient data using a weighted similarity approach; for details, read: Sinha R et al., 2021. DOI: 10.1016/j.crmeth.2021.100039.
More information for the thyroid cancer cell lines is available on cBioPortal using links on the table below.
| Cell Line | % Rank by Avg % Ranks | More Line Info | % Rank by Mutation | % Rank by Copy Number | % Rank by Expression |
|---|---|---|---|---|---|
| TT2609C02 | 0.99 | Link | 0.93 | 0.73 | 0.92 |
| K5 | 0.98 | NA | 0.96 | 0.55 | 0.92 |
| HTCC3 | 0.94 | NA | 0.91 | 0.38 | 1.00 |
| 8305C | 0.91 | Link | 0.92 | 0.34 | 0.92 |
| S117 | 0.91 | Link | 0.73 | 0.48 | 0.95 |
| BCPAP | 0.90 | Link | 0.96 | 0.20 | 0.97 |
| 8505C | 0.86 | Link | 0.95 | 0.18 | 0.92 |
| ASH3 | 0.69 | NA | 0.88 | 0.41 | 0.44 |
| CAL62 | 0.69 | Link | 0.62 | 0.59 | 0.53 |
| CGTHW1 | 0.57 | Link | 0.54 | 0.28 | 0.77 |
| BHT101 | 0.54 | Link | 0.97 | 0.14 | 0.44 |
| FTC133 | 0.45 | Link | 0.42 | 0.04 | 0.98 |
| TT | 0.43 | Link | 0.06 | 0.41 | 0.95 |
| TT | 0.43 | Link | 0.06 | 0.41 | 0.95 |
| IHH4 | 0.40 | NA | 0.90 | 0.11 | 0.36 |
| RO82W1 | 0.40 | NA | 0.06 | 0.44 | 0.88 |
Cell Lines with Common Mutations Found in TCGA Thyroid Cancer
Alterations present in cell lines also present in at least two TCGA Pan-Cancer Atlas (THCA) samples on cBioPortal.
Alterations
BRAF V600E (TCGA Altered: 58.7%; 283 out of 482 samples)
- BCPAP
- BHT101
NRAS Q61R (TCGA Altered: 6%; 29 out of 482 samples)
- TT2609C02
Customized Comparisons
Each project has unique questions. TumorComparer (tumorcomparer.org) facilities customized comparisons of cell line datasets to tumor samples directly from the browser.
Technical Information
This analysis was generated using TumorComparer: 0.99.25. If you use content from this page, please cite Sinha R et al., 2021. DOI: 10.1016/j.crmeth.2021.100039.