Choose Cell Lines for Lung Adenocarcinoma Research: Harvard Sander Lab
NCI-H23, NCI-H1975, NCI-H2009, NCI-H358, and NCI-H522 are some of the most widely used cell lines for lung adenocarcinoma research. Often researchers have questions on selecting the most appropriate cell line(s) for particular research uses.
TumorComparer utilizes several data types (e.g., mutation, copy number, and expression) to perform a comparison of The Cancer Genome Atlas (TCGA) tumor data to experimental cell line models from the Cancer COSMIC Cell Line Project (CCLP) for several cancer types. Please refer to Sinha R et al., 2021. DOI: 10.1016/j.crmeth.2021.100039 for details on the methodology.
An analysis for lung adenocarcinoma cell lines with differences between the lung adenocarcinoma cell lines NCI-H23 vs NCI-H1975; NCI-H23 vs NCI-H2009; NCI-H23 vs NCI-H358; and etc.
If you use content from this page, please cite Sinha R et al., 2021. DOI: 10.1016/j.crmeth.2021.100039.
Characteristics of Lung Adenocarcinoma Cell Lines
The figure shows the presence of alterations for genes (AKT1, STK11, KRAS, EGFR, HRAS, etc.) commonly associated with lung adenocarcinoma in the cell lines: CALU3, NCIH1650, PC14, ABC1, NCIH358, etc. The gene list is retrieved from DisGeNET, and the alteration information is retrieved from cBioPortal for the Cancer Cell Line Encyclopedia (CCLE) dataset.
NOTE: Only a subset of lung adenocarcinoma cell lines are shown to ensure a readable figure. Alterations for additional lung adenocarcinoma cell lines and genes are available on cBioPortal using links on the table below.
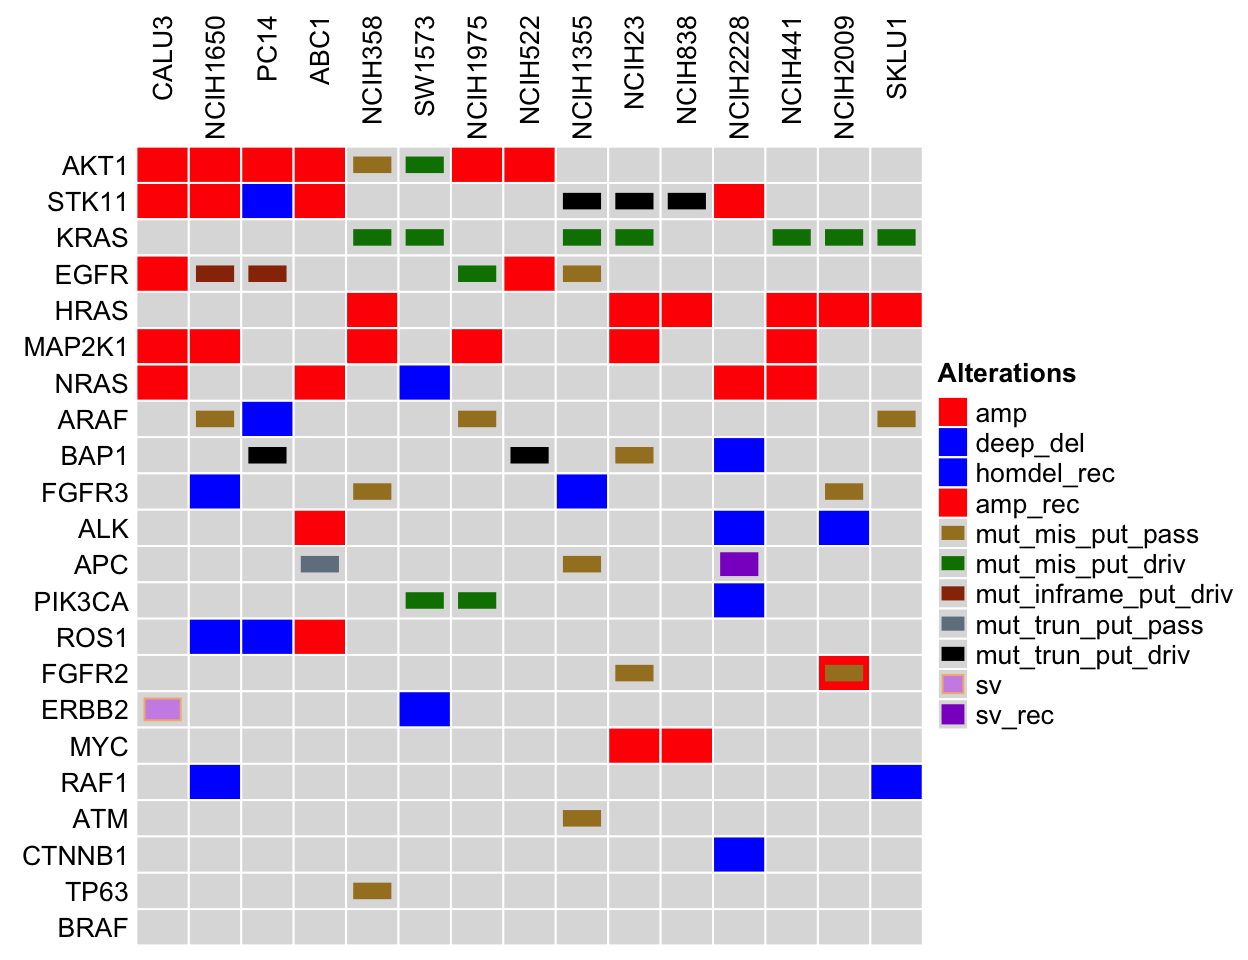
Comparing lung adenocarcinoma cell lines to tumor samples. Legend Abbreviations: mrna_hi = mRNA High; mrna_lo = mRNA Low; prot_hi = Protein High; prot_lo = Protein Low; mut_mis_put_pass = Missense Mutation (putative passenger); mut_mis_put_driv = Missense Mutation (putative driver); mut_inframe_put_pass = Inframe Mutation (putative passenger); mut_inframe_put_driv = Inframe Mutation (putative driver); mut_trun_put_pass = Truncating mutation (putative passenger); mut_trun_put_driv = Truncating mutation (putative driver); amp = Amplification; deep_del = Deep Deletion; homdel_rec = homdel_rec; amp_rec = amp_rec; sv = sv; sv_rec = sv_rec; splice = splice
List of Lung Adenocarcinoma Cell Lines Compared to Pan-Cancer TCGA
The TumorComparer analysis examines the most variably expressed genes, as well as alteration information for cell lines and TCGA patient data using a weighted similarity approach; for details, read: Sinha R et al., 2021. DOI: 10.1016/j.crmeth.2021.100039.
More information for the lung adenocarcinoma cell lines is available on cBioPortal using links on the table below.
| Cell Line | % Rank by Avg % Ranks | More Line Info | % Rank by Mutation | % Rank by Copy Number | % Rank by Expression |
|---|---|---|---|---|---|
| LC2AD | 1.00 | NA | 0.97 | 0.97 | 0.99 |
| HCC78 | 0.99 | Link | 0.93 | 0.90 | 1.00 |
| NCIH3122 | 0.99 | NA | 0.97 | 0.76 | 0.98 |
| NCIH441 | 0.99 | Link | 0.86 | 0.86 | 1.00 |
| NCIH1650 | 0.98 | Link | 0.97 | 0.83 | 0.75 |
| NCIH2009 | 0.97 | Link | 0.75 | 0.97 | 0.78 |
| NCIH2291 | 0.97 | Link | 0.75 | 0.76 | 0.98 |
| NCIH322M | 0.97 | NA | 0.68 | 0.97 | 0.83 |
| NCIH1944 | 0.95 | Link | 0.60 | 0.90 | 0.97 |
| PC14 | 0.95 | Link | 0.87 | 0.76 | 0.83 |
| NCIH1648 | 0.94 | Link | 0.84 | 0.63 | 0.97 |
| NCIH1781 | 0.94 | Link | 0.66 | 0.80 | 0.97 |
| RERFLCKJ | 0.93 | Link | 0.72 | 0.72 | 0.95 |
| HOP62 | 0.91 | NA | 0.68 | 0.90 | 0.75 |
| NCIH1651 | 0.91 | Link | 0.78 | 0.94 | 0.59 |
| 201T | 0.90 | NA | 0.99 | 0.41 | 0.88 |
| H3255 | 0.90 | NA | 0.66 | 0.63 | 0.99 |
| NCIH1993 | 0.90 | NA | 0.41 | 0.97 | 0.91 |
| NCIH2228 | 0.90 | Link | 0.93 | 0.41 | 0.91 |
| NCIH1568 | 0.88 | Link | 0.55 | 0.83 | 0.83 |
| NCIH2347 | 0.88 | Link | 0.58 | 0.63 | 1.00 |
| NCIH2122 | 0.87 | Link | 0.58 | 0.63 | 0.99 |
| NCIH1623 | 0.86 | Link | 0.44 | 0.90 | 0.83 |
| NCIH2405 | 0.84 | Link | 0.72 | 0.76 | 0.65 |
| NCIH2087 | 0.83 | Link | 0.63 | 0.49 | 0.99 |
| ABC1 | 0.82 | Link | 0.82 | 0.76 | 0.49 |
| HCC827 | 0.82 | Link | 0.99 | 0.11 | 0.98 |
| NCIH358 | 0.80 | Link | 0.63 | 0.41 | 0.97 |
| CALU3 | 0.78 | Link | 0.57 | 0.49 | 0.90 |
| VMRCLCD | 0.78 | NA | 0.66 | 0.45 | 0.85 |
| NCIH1975 | 0.76 | Link | 0.51 | 0.45 | 0.97 |
| HCC44 | 0.75 | Link | 0.53 | 0.54 | 0.81 |
| NCIH23 | 0.73 | Link | 0.46 | 0.97 | 0.44 |
| NCIH1838 | 0.70 | Link | 0.48 | 0.49 | 0.83 |
| NCIH2342 | 0.70 | Link | 0.50 | 0.54 | 0.75 |
| NCIH1573 | 0.68 | Link | 0.44 | 0.37 | 0.95 |
| NCIH1734 | 0.68 | Link | 0.60 | 0.20 | 0.98 |
| NCIH1755 | 0.68 | Link | 0.37 | 0.86 | 0.55 |
| CORL105 | 0.66 | Link | 0.21 | 0.96 | 0.59 |
| NCIH522 | 0.66 | Link | 0.60 | 0.94 | 0.21 |
| NCIH838 | 0.66 | Link | 0.46 | 0.49 | 0.78 |
| A549 | 0.64 | Link | 0.49 | 0.54 | 0.69 |
| NCIH1792 | 0.64 | Link | 0.31 | 0.67 | 0.72 |
| NCIH1355 | 0.60 | Link | 0.53 | 0.35 | 0.78 |
| NCIH1666 | 0.57 | Link | 0.33 | 0.37 | 0.88 |
| NCIH2030 | 0.55 | Link | 0.60 | 0.28 | 0.69 |
| LXF289 | 0.53 | Link | 0.33 | 0.49 | 0.72 |
| NCIH650 | 0.53 | Link | 0.56 | 0.37 | 0.59 |
| NCIH1693 | 0.42 | Link | 0.44 | 0.28 | 0.65 |
| NCIH1563 | 0.36 | Link | 0.22 | 0.72 | 0.33 |
| SKLU1 | 0.36 | Link | 0.51 | 0.25 | 0.49 |
| NCIH1793 | 0.32 | Link | 0.32 | 0.17 | 0.72 |
| RERFLCMS | 0.28 | Link | 0.70 | 0.06 | 0.38 |
| A427 | 0.20 | NA | 0.33 | 0.45 | 0.21 |
| NCIH82 | 0.08 | NA | 0.05 | 0.22 | 0.44 |
| SW1573 | 0.03 | Link | 0.27 | 0.11 | 0.06 |
Cell Lines with Common Mutations Found in TCGA Lung Adenocarcinoma
Alterations present in cell lines also present in at least two TCGA Pan-Cancer Atlas (LUAD) samples on cBioPortal.
Alterations
BRAF G466V (TCGA Altered: 1%; 5 out of 507 samples)
- CAL12T
- NCIH1666
BRAF G469A (TCGA Altered: 0.4%; 2 out of 507 samples)
- NCIH1395
- NCIH1755
BRAF V600E (TCGA Altered: 1.8%; 9 out of 507 samples)
- HCC364
- NCIH854
EGFR L858R (TCGA Altered: 4.1%; 21 out of 507 samples)
- NCIH1975
- NCIH2172
- NCIH3255
EGFR T790M (TCGA Altered: 0.4%; 2 out of 507 samples)
- NCIH1975
KRAS G12A (TCGA Altered: 3.2%; 16 out of 507 samples)
- NCIH1573
- NCIH2009
- RERFLCAD1
KRAS G12C (TCGA Altered: 13.2%; 67 out of 507 samples)
- CALU1
- HCC1171
- HCC44
- HOP62
- IALM
- LU65
- LU99
- NCIH1373
- NCIH1385
- NCIH1792
- NCIH2030
- NCIH2122
- NCIH2291
- NCIH23
- NCIH358
- SW1573
KRAS G12D (TCGA Altered: 3.7%; 19 out of 507 samples)
- SKLU1
- T3M10
KRAS G12S (TCGA Altered: 1%; 5 out of 507 samples)
- A549
KRAS G12V (TCGA Altered: 7.1%; 36 out of 507 samples)
- COLO668
- CORL23
- LCLC97TM1
- NCIH2291
- NCIH2444
- NCIH441
- NCIH727
- RERFLCAD2
- SHP77
- SW900
KRAS G13C (TCGA Altered: 1.2%; 6 out of 507 samples)
- MORCPR
- NCIH1355
- NCIH1734
KRAS G13D (TCGA Altered: 0.6%; 3 out of 507 samples)
- DV90
- NCIH1944
- NCIH647
KRAS L19F (TCGA Altered: 0.6%; 3 out of 507 samples)
- NCIH2347
KRAS Q61L (TCGA Altered: 0.4%; 2 out of 507 samples)
- NCIH650
STK11 D194Y (TCGA Altered: 0.4%; 2 out of 507 samples)
- DMS53
STK11 G242W (TCGA Altered: 0.4%; 2 out of 507 samples)
- NCIH1563
PIK3CA E542K (TCGA Altered: 0.8%; 4 out of 507 samples)
- NCIH1341
- NCIH1563
PIK3CA E545K (TCGA Altered: 1.2%; 6 out of 507 samples)
- NCIH460
- NCIH596
- RERFLCSQ1
PIK3CA H1047R (TCGA Altered: 0.4%; 2 out of 507 samples)
- NCIH1048
Customized Comparisons
Each project has unique questions. TumorComparer (tumorcomparer.org) facilities customized comparisons of cell line datasets to tumor samples directly from the browser.
Technical Information
This analysis was generated using TumorComparer: 0.99.25. If you use content from this page, please cite Sinha R et al., 2021. DOI: 10.1016/j.crmeth.2021.100039.