Choose Cell Lines for Kidney Cancer Research: Harvard Sander Lab
ACHN, SN12C, OS-RC-2, 769-P, and SK-NEP-1 are some of the most widely used cell lines for kidney cancer research. Often researchers have questions on selecting the most appropriate cell line(s) for particular research uses.
TumorComparer utilizes several data types (e.g., mutation, copy number, and expression) to perform a comparison of The Cancer Genome Atlas (TCGA) tumor data to experimental cell line models from the Cancer COSMIC Cell Line Project (CCLP) for several cancer types. Please refer to Sinha R et al., 2021. DOI: 10.1016/j.crmeth.2021.100039 for details on the methodology.
An analysis for kidney cancer cell lines with differences between the kidney cancer cell lines ACHN vs SN12C; ACHN vs OS-RC-2; ACHN vs 769-P; and etc.
If you use content from this page, please cite Sinha R et al., 2021. DOI: 10.1016/j.crmeth.2021.100039.
Characteristics of Kidney Cancer Cell Lines
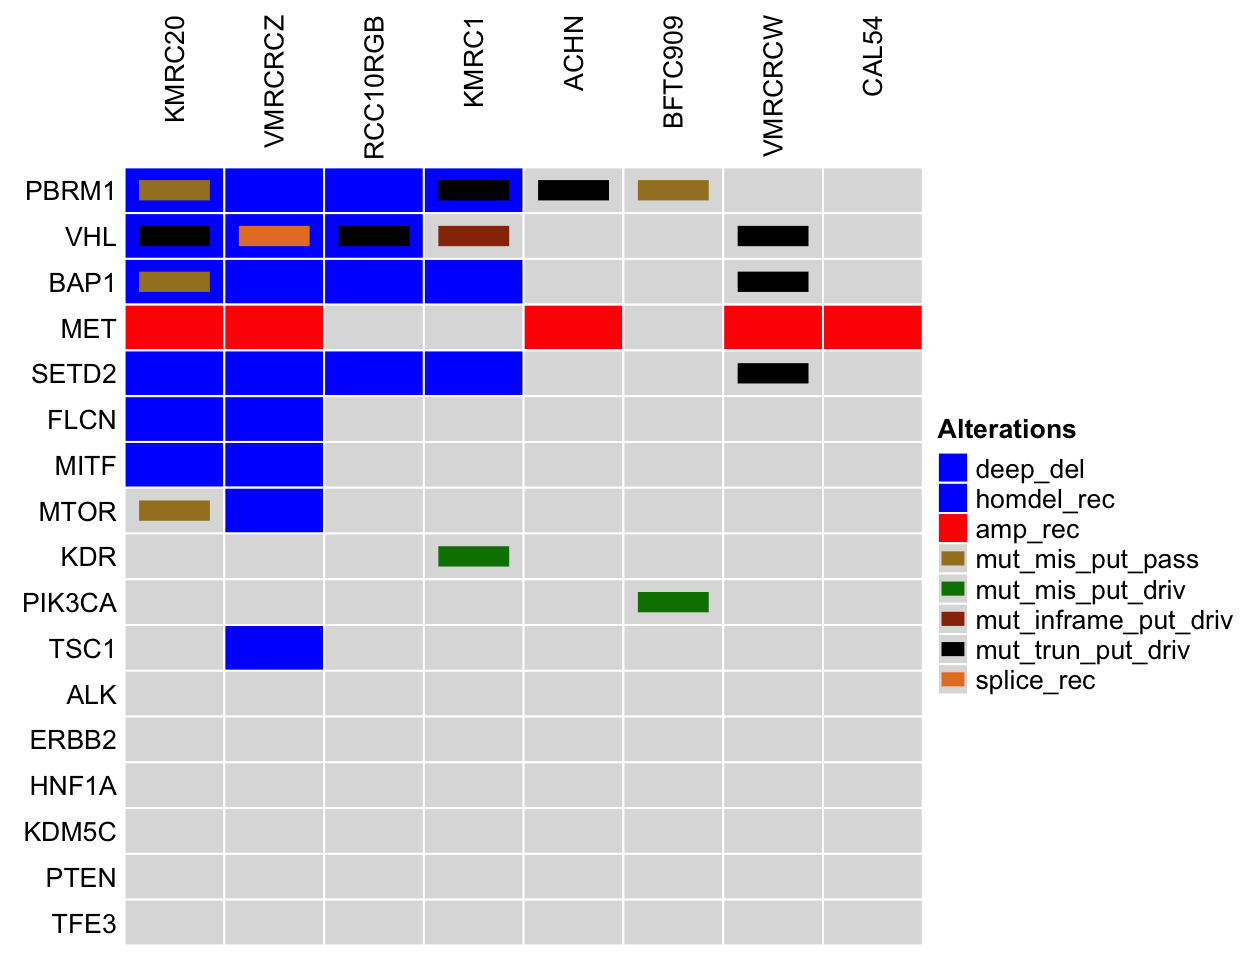
The figure shows the presence of alterations for genes (PBRM1, VHL, BAP1, MET, SETD2, etc.) commonly associated with kidney cancer in the cell lines: KMRC20, VMRCRCZ, RCC10RGB, KMRC1, ACHN, etc. The gene list is retrieved from DisGeNET, and the alteration information is retrieved from cBioPortal for the Cancer Cell Line Encyclopedia (CCLE) dataset.
NOTE: Only a subset of kidney cancer cell lines are shown to ensure a readable figure. Alterations for additional kidney cancer cell lines and genes are available on cBioPortal using links on the table below.
Comparing kidney cancer cell lines to tumor samples. Legend Abbreviations: mrna_hi = mRNA High; mrna_lo = mRNA Low; prot_hi = Protein High; prot_lo = Protein Low; mut_mis_put_pass = Missense Mutation (putative passenger); mut_mis_put_driv = Missense Mutation (putative driver); mut_inframe_put_pass = Inframe Mutation (putative passenger); mut_inframe_put_driv = Inframe Mutation (putative driver); mut_trun_put_pass = Truncating mutation (putative passenger); mut_trun_put_driv = Truncating mutation (putative driver); amp = Amplification; deep_del = Deep Deletion; homdel_rec = homdel_rec; amp_rec = amp_rec; sv = sv; sv_rec = sv_rec; splice = splice
List of Kidney Cancer Cell Lines Compared to Pan-Cancer TCGA
The TumorComparer analysis examines the most variably expressed genes, as well as alteration information for cell lines and TCGA patient data using a weighted similarity approach; for details, read: Sinha R et al., 2021. DOI: 10.1016/j.crmeth.2021.100039.
More information for the kidney cancer cell lines is available on cBioPortal using links on the table below.
| Cell Line | % Rank by Avg % Ranks | More Line Info | % Rank by Mutation | % Rank by Copy Number | % Rank by Expression |
|---|---|---|---|---|---|
| NCC010 | 1.00 | NA | 0.99 | 0.96 | 1.00 |
| RCCAB | 1.00 | NA | 0.98 | 0.91 | 0.98 |
| LB996RCC | 0.99 | NA | 0.92 | 0.89 | 0.97 |
| OSRC2 | 0.99 | NA | 0.99 | 0.69 | 1.00 |
| VMRCRCZ | 0.99 | Link | 0.83 | 0.97 | 0.98 |
| KMRC1 | 0.98 | Link | 1.00 | 0.56 | 0.99 |
| RCCER | 0.98 | NA | 0.78 | 0.69 | 1.00 |
| RCCFG2 | 0.98 | NA | 0.57 | 0.99 | 1.00 |
| RCCMF | 0.98 | NA | 0.99 | 0.49 | 0.99 |
| HA7RCC | 0.96 | NA | 0.99 | 0.35 | 0.99 |
| KMRC20 | 0.93 | Link | 0.99 | 0.25 | 0.98 |
| RCCJF | 0.93 | NA | 0.99 | 0.25 | 0.99 |
| CAL54 | 0.90 | Link | 0.25 | 0.91 | 0.98 |
| RCCJW | 0.90 | NA | 0.51 | 0.64 | 1.00 |
| A704 | 0.88 | Link | 0.51 | 0.56 | 1.00 |
| ACHN | 0.88 | Link | 1.00 | 0.08 | 0.99 |
| NCC021 | 0.88 | NA | 0.30 | 0.78 | 0.99 |
| A498 | 0.87 | Link | 0.92 | 0.15 | 0.98 |
| BB65RCC | 0.85 | NA | 0.53 | 0.49 | 0.99 |
| RXF393 | 0.85 | NA | 0.83 | 0.20 | 0.98 |
| SN12C | 0.78 | NA | 0.70 | 0.39 | 0.78 |
| 769P | 0.76 | Link | 0.04 | 0.82 | 0.98 |
| SKNEP1 | 0.76 | NA | 0.96 | 0.42 | 0.46 |
| BFTC909 | 0.66 | Link | 0.46 | 0.27 | 0.97 |
| RCC10RGB | 0.64 | Link | 0.20 | 0.49 | 0.99 |
| CAKI1 | 0.50 | Link | 0.04 | 0.49 | 0.98 |
| TK10 | 0.45 | NA | 0.18 | 0.30 | 0.97 |
| U031 | 0.45 | NA | 0.04 | 0.42 | 0.97 |
| LB1047RCC | 0.43 | NA | 0.04 | 0.42 | 0.94 |
| LB2241RCC | 0.22 | NA | 0.04 | 0.08 | 0.98 |
Customized Comparisons
Each project has unique questions. TumorComparer (tumorcomparer.org) facilities customized comparisons of cell line datasets to tumor samples directly from the browser.
Technical Information
This analysis was generated using TumorComparer: 0.99.25. If you use content from this page, please cite Sinha R et al., 2021. DOI: 10.1016/j.crmeth.2021.100039.