Choose Cell Lines for Colon Cancer Research: Harvard Sander Lab
SW620, LoVo, T84, SW48, and SW1116 are some of the most widely used cell lines for colon cancer research. Often researchers have questions on selecting the most appropriate cell line(s) for particular research uses.
TumorComparer utilizes several data types (e.g., mutation, copy number, and expression) to perform a comparison of The Cancer Genome Atlas (TCGA) tumor data to experimental cell line models from the Cancer COSMIC Cell Line Project (CCLP) for several cancer types. Please refer to Sinha R et al., 2021. DOI: 10.1016/j.crmeth.2021.100039 for details on the methodology.
An analysis for colon cancer cell lines with differences between the colon cancer cell lines SW620 vs LoVo; SW620 vs T84; SW620 vs SW48; and etc.
If you use content from this page, please cite Sinha R et al., 2021. DOI: 10.1016/j.crmeth.2021.100039.
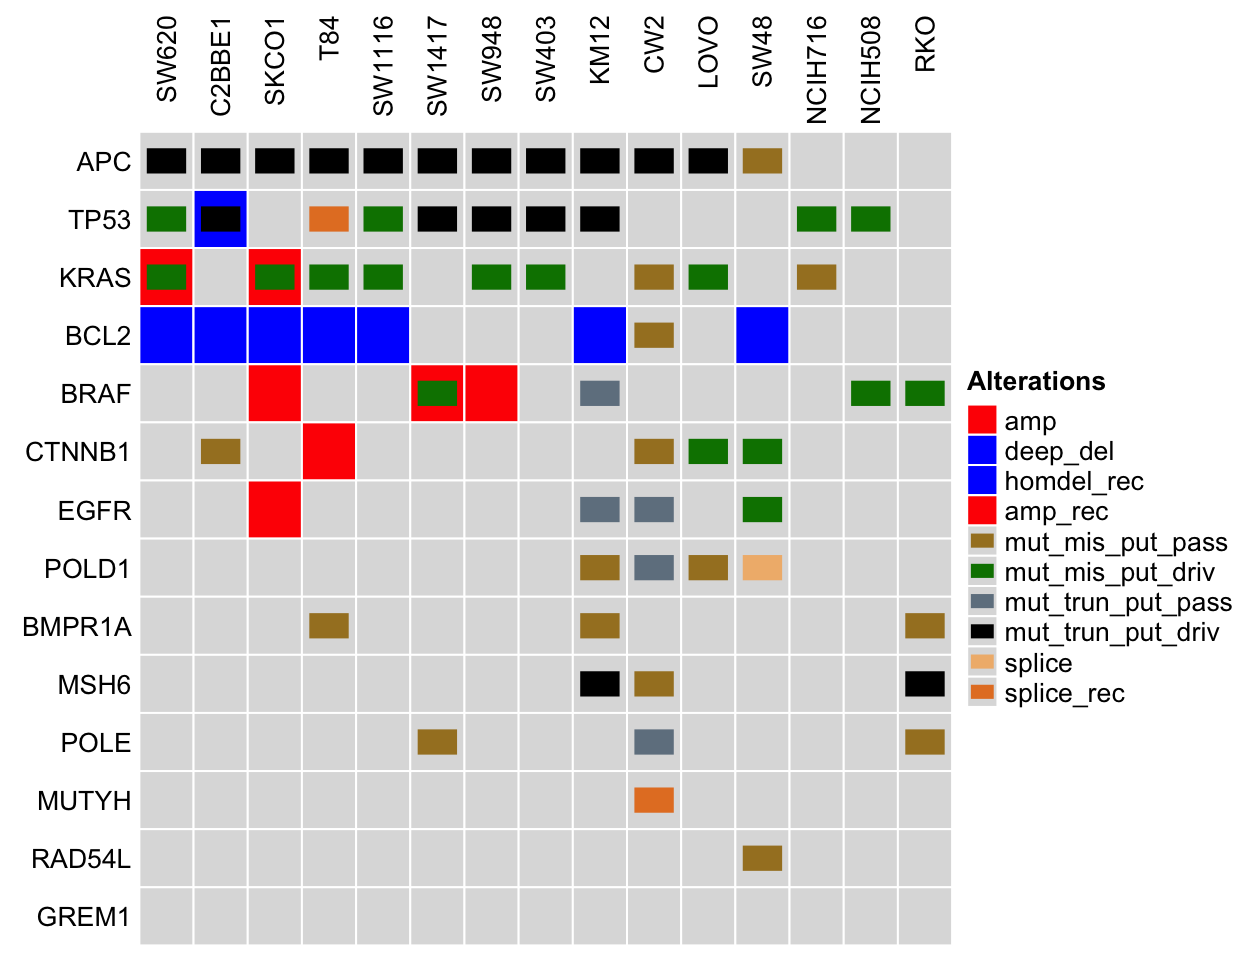
Characteristics of Colon Cancer Cell Lines
The figure shows the presence of alterations for genes (APC, TP53, KRAS, BCL2, BRAF, etc.) commonly associated with colon cancer in the cell lines: SW620, C2BBE1, SKCO1, T84, SW1116, etc. The gene list is retrieved from DisGeNET, and the alteration information is retrieved from cBioPortal for the Cancer Cell Line Encyclopedia (CCLE) dataset.
NOTE: Only a subset of colon cancer cell lines are shown to ensure a readable figure. Alterations for additional colon cancer cell lines and genes are available on cBioPortal using links on the table below.
Comparing colon cancer cell lines to tumor samples. Legend Abbreviations: mrna_hi = mRNA High; mrna_lo = mRNA Low; prot_hi = Protein High; prot_lo = Protein Low; mut_mis_put_pass = Missense Mutation (putative passenger); mut_mis_put_driv = Missense Mutation (putative driver); mut_inframe_put_pass = Inframe Mutation (putative passenger); mut_inframe_put_driv = Inframe Mutation (putative driver); mut_trun_put_pass = Truncating mutation (putative passenger); mut_trun_put_driv = Truncating mutation (putative driver); amp = Amplification; deep_del = Deep Deletion; homdel_rec = homdel_rec; amp_rec = amp_rec; sv = sv; sv_rec = sv_rec; splice = splice
List of Colon Cancer Cell Lines Compared to Pan-Cancer TCGA
The TumorComparer analysis examines the most variably expressed genes, as well as alteration information for cell lines and TCGA patient data using a weighted similarity approach; for details, read: Sinha R et al., 2021. DOI: 10.1016/j.crmeth.2021.100039.
More information for the colon cancer cell lines is available on cBioPortal using links on the table below.
| Cell Line | % Rank by Avg % Ranks | More Line Info | % Rank by Mutation | % Rank by Copy Number | % Rank by Expression |
|---|---|---|---|---|---|
| LS123 | 0.99 | Link | 0.84 | 0.89 | 0.94 |
| SNUC1 | 0.99 | Link | 0.94 | 0.79 | 0.98 |
| SW626 | 0.99 | NA | 0.84 | 0.87 | 0.92 |
| SW948 | 0.99 | Link | 0.99 | 0.71 | 0.99 |
| HCT15 | 0.98 | Link | 0.74 | 0.92 | 0.95 |
| SW620 | 0.97 | Link | 1.00 | 0.56 | 0.92 |
| CL34 | 0.96 | Link | 0.50 | 0.95 | 1.00 |
| HT115 | 0.96 | Link | 0.50 | 0.93 | 0.99 |
| SW1417 | 0.96 | Link | 0.58 | 0.87 | 0.97 |
| HCC56 | 0.95 | Link | 0.84 | 0.56 | 1.00 |
| SW1116 | 0.95 | Link | 0.98 | 0.39 | 0.98 |
| LOVO | 0.94 | Link | 0.45 | 0.99 | 0.89 |
| HCC2998 | 0.93 | NA | 0.34 | 0.98 | 0.99 |
| LS1034 | 0.93 | Link | 1.00 | 0.31 | 1.00 |
| SNU407 | 0.93 | Link | 0.42 | 0.95 | 0.96 |
| HT55 | 0.92 | Link | 0.55 | 0.73 | 0.99 |
| LS513 | 0.92 | Link | 0.37 | 0.92 | 1.00 |
| KM12 | 0.91 | Link | 0.38 | 0.89 | 0.96 |
| COLO205 | 0.90 | Link | 0.62 | 0.64 | 0.97 |
| GP5D | 0.90 | NA | 0.40 | 0.82 | 0.98 |
| LS180 | 0.90 | Link | 0.32 | 0.89 | 0.99 |
| SNU81 | 0.90 | Link | 0.44 | 0.79 | 0.98 |
| CL40 | 0.89 | Link | 0.88 | 0.31 | 1.00 |
| SNU1040 | 0.88 | Link | 0.30 | 0.92 | 0.95 |
| SW48 | 0.88 | Link | 0.22 | 1.00 | 0.94 |
| CL11 | 0.86 | Link | 0.99 | 0.18 | 0.96 |
| RKO | 0.86 | Link | 0.35 | 0.89 | 0.88 |
| T84 | 0.86 | Link | 0.99 | 0.16 | 0.99 |
| COLO678 | 0.85 | Link | 0.99 | 0.18 | 0.92 |
| HCT116 | 0.82 | Link | 0.32 | 0.82 | 0.90 |
| NCIH747 | 0.80 | Link | 0.98 | 0.10 | 0.94 |
| CCK81 | 0.79 | Link | 0.34 | 0.66 | 0.97 |
| LS411N | 0.79 | Link | 0.35 | 0.64 | 0.99 |
| SKCO1 | 0.77 | Link | 1.00 | 0.64 | 0.30 |
| NCIH716 | 0.72 | Link | 0.79 | 0.18 | 0.90 |
| C2BBE1 | 0.69 | Link | 0.59 | 0.26 | 0.93 |
| MDST8 | 0.59 | Link | 0.46 | 0.66 | 0.51 |
| SNUC2B | 0.59 | NA | 0.37 | 0.34 | 0.95 |
| SNUC5 | 0.54 | Link | 0.42 | 0.20 | 0.95 |
| COLO320HSR | 0.47 | NA | 1.00 | 0.26 | 0.20 |
| SNU175 | 0.39 | Link | 0.37 | 0.02 | 0.94 |
| CW2 | 0.35 | Link | 0.24 | 0.01 | 0.98 |
Cell Lines with Common Mutations Found in TCGA Colon Cancer
Alterations present in cell lines also present in at least two TCGA Pan-Cancer Atlas (COAD) samples on cBioPortal.
Alterations
CTNNB1 R582Q (TCGA Altered: 0.4%; 2 out of 526 samples)
- CW2
CTNNB1 S45F (TCGA Altered: 0.6%; 3 out of 526 samples)
- LS180
CTNNB1 T41A (TCGA Altered: 0.8%; 4 out of 526 samples)
- CCK81
- SNU407
KRAS A146T (TCGA Altered: 3%; 16 out of 526 samples)
- LS1034
- SNU81
KRAS G12A (TCGA Altered: 1.9%; 10 out of 526 samples)
- SW1116
KRAS G12C (TCGA Altered: 2.9%; 15 out of 526 samples)
- SW1463
- SW837
KRAS G12D (TCGA Altered: 10.8%; 57 out of 526 samples)
- CL40
- COLO678
- GP2D
- LS180
- LS513
- SNU1033
- SNU1197
- SNU407
- SNU61
- SNUC2A
KRAS G12S (TCGA Altered: 1.5%; 8 out of 526 samples)
- LS123
KRAS G12V (TCGA Altered: 9.3%; 49 out of 526 samples)
- HCC56
- RCM1
- SKCO1
- SW403
- SW480
- SW620
KRAS G13D (TCGA Altered: 7%; 37 out of 526 samples)
- HCT116
- HCT15
- HRT18
- LOVO
- NCIH747
- T84
KRAS Q61H (TCGA Altered: 0.8%; 4 out of 526 samples)
- CL11
POLE P286R (TCGA Altered: 0.4%; 2 out of 526 samples)
- SNU81
POLE V411L (TCGA Altered: 0.8%; 4 out of 526 samples)
- HT115
TP53 G245S (TCGA Altered: 1.1%; 6 out of 526 samples)
- LS1034
- SNUC4
TP53 R175H (TCGA Altered: 6.1%; 32 out of 526 samples)
- LS123
- SNU1197
- SNU61
TP53 R248Q (TCGA Altered: 3.4%; 18 out of 526 samples)
- CL40
- SW1463
TP53 R248W (TCGA Altered: 2.9%; 15 out of 526 samples)
- COLO320
- SNU1040
- SNUC5
- SW837
TP53 R273C (TCGA Altered: 2.3%; 12 out of 526 samples)
- CL14
- SNUC2A
TP53 R273H (TCGA Altered: 3.2%; 17 out of 526 samples)
- HT29
- NCIH508
- SNUC2A
- SW480
- SW620
BRAF V600E (TCGA Altered: 9.1%; 48 out of 526 samples)
- CL34
- COLO205
- HT29
- LS411N
- MDST8
- OUMS23
- RKO
- SNUC5
- SW1417
Customized Comparisons
Each project has unique questions. TumorComparer (tumorcomparer.org) facilities customized comparisons of cell line datasets to tumor samples directly from the browser.
Technical Information
This analysis was generated using TumorComparer: 0.99.25. If you use content from this page, please cite Sinha R et al., 2021. DOI: 10.1016/j.crmeth.2021.100039.