Choose Cell Lines for Breast Cancer Research: Harvard Sander Lab
MDA-MB-231, MDA-MB-468, BT-474, BT-20, and MDA-MB-453 are some of the most widely used cell lines for breast cancer research. Often researchers have questions on selecting the most appropriate cell line(s) for particular research uses.
TumorComparer utilizes several data types (e.g., mutation, copy number, and expression) to perform a comparison of The Cancer Genome Atlas (TCGA) tumor data to experimental cell line models from the Cancer COSMIC Cell Line Project (CCLP) for several cancer types. Please refer to Sinha R et al., 2021. DOI: 10.1016/j.crmeth.2021.100039 for details on the methodology.
An analysis for breast cancer cell lines with differences between the breast cancer cell lines MDA-MB-231 vs MDA-MB-468; MDA-MB-231 vs BT-474; MDA-MB-231 vs BT-20; and etc.
If you use content from this page, please cite Sinha R et al., 2021. DOI: 10.1016/j.crmeth.2021.100039.
Characteristics of Breast Cancer Cell Lines
The figure shows the presence of alterations for genes (TP53, PIK3CA, ERBB2, CD274, MYC, etc.) commonly associated with breast cancer in the cell lines: BT474, JIMT1, HCC38, HCC1954, MDAMB361, etc. The gene list is retrieved from DisGeNET, and the alteration information is retrieved from cBioPortal for the Cancer Cell Line Encyclopedia (CCLE) dataset.
NOTE: Only a subset of breast cancer cell lines are shown to ensure a readable figure. Alterations for additional breast cancer cell lines and genes are available on cBioPortal using links on the table below.
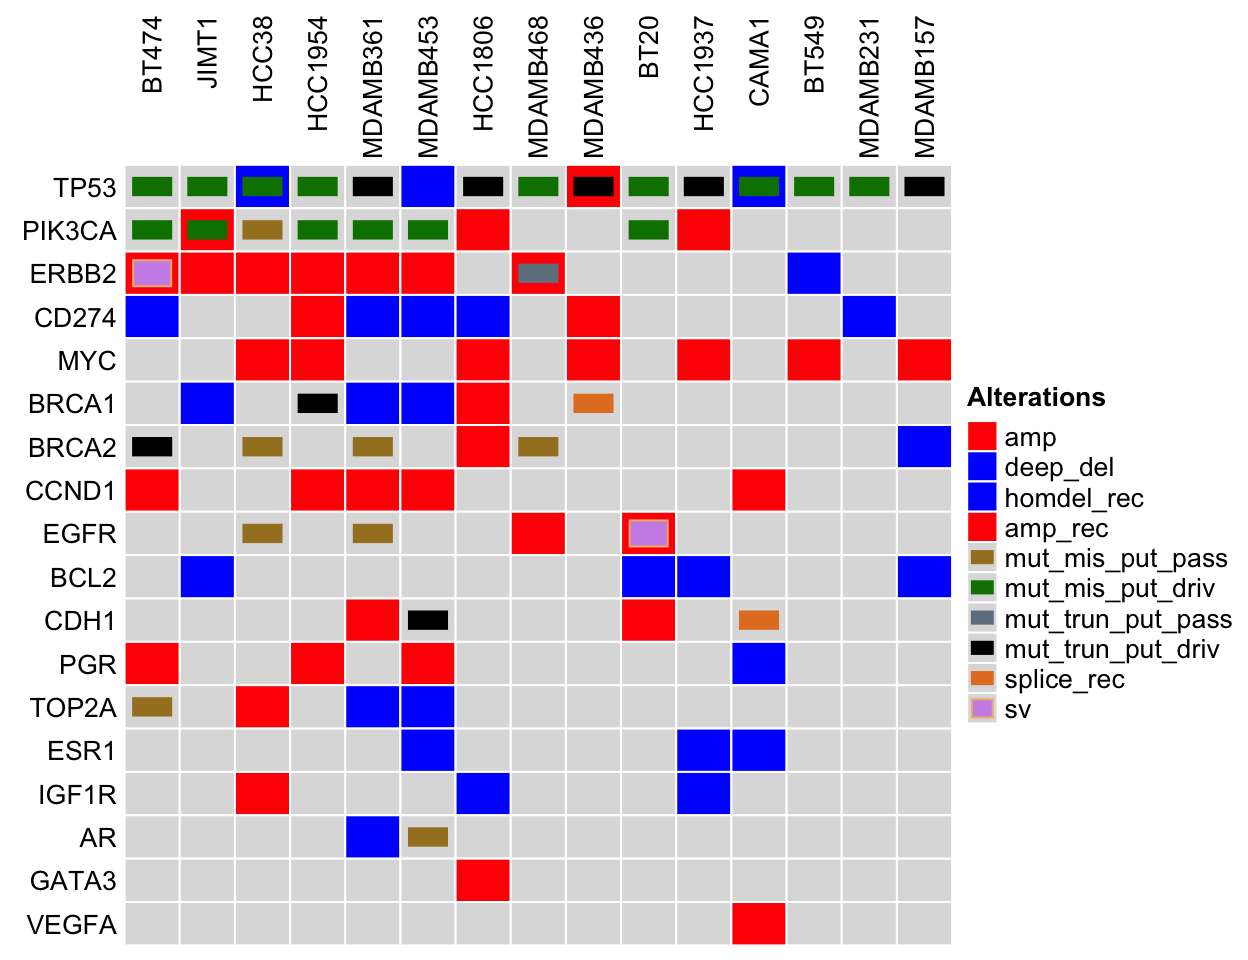
Comparing breast cancer cell lines to tumor samples. Legend Abbreviations: mrna_hi = mRNA High; mrna_lo = mRNA Low; prot_hi = Protein High; prot_lo = Protein Low; mut_mis_put_pass = Missense Mutation (putative passenger); mut_mis_put_driv = Missense Mutation (putative driver); mut_inframe_put_pass = Inframe Mutation (putative passenger); mut_inframe_put_driv = Inframe Mutation (putative driver); mut_trun_put_pass = Truncating mutation (putative passenger); mut_trun_put_driv = Truncating mutation (putative driver); amp = Amplification; deep_del = Deep Deletion; homdel_rec = homdel_rec; amp_rec = amp_rec; sv = sv; sv_rec = sv_rec; splice = splice
List of Breast Cancer Cell Lines Compared to Pan-Cancer TCGA
The TumorComparer analysis examines the most variably expressed genes, as well as alteration information for cell lines and TCGA patient data using a weighted similarity approach; for details, read: Sinha R et al., 2021. DOI: 10.1016/j.crmeth.2021.100039.
More information for the breast cancer cell lines is available on cBioPortal using links on the table below.
| Cell Line | % Rank by Avg % Ranks | More Line Info | % Rank by Mutation | % Rank by Copy Number | % Rank by Expression |
|---|---|---|---|---|---|
| BT474 | 1.00 | Link | 0.93 | 0.98 | 0.99 |
| CAMA1 | 1.00 | Link | 0.88 | 0.95 | 1.00 |
| EFM19 | 1.00 | Link | 0.96 | 0.92 | 1.00 |
| HCC1937 | 1.00 | Link | 0.96 | 0.95 | 0.95 |
| BT483 | 0.99 | Link | 0.86 | 0.89 | 1.00 |
| CAL851 | 0.99 | Link | 0.96 | 0.81 | 0.95 |
| HCC1143 | 0.99 | Link | 0.96 | 0.92 | 0.86 |
| HCC2157 | 0.99 | Link | 0.90 | 0.87 | 0.98 |
| MDAMB415 | 0.99 | Link | 0.86 | 0.89 | 0.98 |
| MDAMB453 | 0.99 | Link | 0.83 | 0.84 | 0.99 |
| UACC893 | 0.99 | Link | 0.96 | 0.81 | 0.98 |
| EFM192A | 0.98 | Link | 0.99 | 0.62 | 0.98 |
| HS578T | 0.98 | Link | 0.83 | 0.87 | 0.91 |
| ZR7530 | 0.98 | Link | 0.86 | 0.73 | 1.00 |
| AU565 | 0.97 | Link | 0.86 | 0.73 | 0.93 |
| BT549 | 0.96 | Link | 0.88 | 0.73 | 0.88 |
| HCC202 | 0.96 | Link | 0.61 | 0.89 | 0.98 |
| HCC70 | 0.95 | Link | 0.57 | 0.92 | 0.97 |
| OCUBM | 0.95 | NA | 0.52 | 0.93 | 0.99 |
| MDAMB361 | 0.94 | Link | 0.46 | 0.93 | 1.00 |
| T47D | 0.94 | Link | 0.56 | 0.84 | 0.99 |
| MDAMB330 | 0.92 | NA | 0.93 | 0.44 | 0.98 |
| BT20 | 0.90 | Link | 0.86 | 0.47 | 0.96 |
| HCC1419 | 0.90 | Link | 0.88 | 0.40 | 0.99 |
| HCC1569 | 0.90 | Link | 0.54 | 0.77 | 0.95 |
| HCC1395 | 0.89 | Link | 0.88 | 0.47 | 0.88 |
| MCF7 | 0.89 | Link | 0.76 | 0.50 | 0.98 |
| MDAMB436 | 0.89 | Link | 0.88 | 0.70 | 0.68 |
| HCC1954 | 0.88 | Link | 0.96 | 0.30 | 0.97 |
| MDAMB468 | 0.88 | Link | 0.48 | 0.77 | 0.97 |
| HCC1500 | 0.87 | Link | 0.33 | 0.84 | 1.00 |
| MDAMB157 | 0.86 | Link | 0.46 | 0.73 | 0.96 |
| HCC1599 | 0.84 | Link | 0.17 | 0.95 | 0.97 |
| MFM223 | 0.84 | NA | 0.96 | 0.16 | 0.98 |
| HCC1806 | 0.82 | Link | 0.72 | 0.58 | 0.76 |
| HCC2218 | 0.82 | Link | 0.11 | 0.98 | 0.98 |
| HDQP1 | 0.82 | Link | 0.81 | 0.70 | 0.56 |
| EVSAT | 0.81 | NA | 0.79 | 0.30 | 0.97 |
| HCC38 | 0.78 | Link | 0.90 | 0.14 | 0.94 |
| HCC1187 | 0.76 | Link | 0.84 | 0.11 | 0.95 |
| JIMT1 | 0.73 | Link | 0.56 | 0.66 | 0.63 |
| CAL148 | 0.70 | Link | 0.71 | 0.14 | 0.97 |
| MRKNU1 | 0.53 | NA | 0.33 | 0.30 | 0.91 |
| HCC1428 | 0.44 | Link | 0.22 | 0.20 | 1.00 |
| MDAMB231 | 0.39 | Link | 0.36 | 0.58 | 0.38 |
| UACC812 | 0.39 | Link | 0.15 | 0.20 | 0.98 |
| COLO824 | 0.30 | NA | 0.09 | 0.11 | 0.98 |
| DU4475 | 0.19 | Link | 0.14 | 0.47 | 0.38 |
| CAL120 | 0.05 | Link | 0.05 | 0.20 | 0.31 |
| CAL51 | 0.03 | Link | 0.45 | 0.01 | 0.02 |
Cell Lines with Common Mutations Found in TCGA Breast Cancer
Alterations present in cell lines also present in at least two TCGA Pan-Cancer Atlas (BRCA) samples on cBioPortal.
Alterations
PIK3CA C420R (TCGA Altered: 0.5%; 5 out of 996 samples)
- EFM192A
- JIMT1
PIK3CA E542K (TCGA Altered: 4.2%; 42 out of 996 samples)
- BT483
- CAL51
PIK3CA E545K (TCGA Altered: 6.5%; 65 out of 996 samples)
- HCC202
- KPL1
- MCF7
- MDAMB361
PIK3CA H1047L (TCGA Altered: 1.3%; 13 out of 996 samples)
- EFM19
PIK3CA H1047R (TCGA Altered: 13%; 129 out of 996 samples)
- BT20
- CAL148
- HCC1954
- MDAMB453
- T47D
- UACC893
TP53 E285K (TCGA Altered: 0.4%; 4 out of 996 samples)
- BT474
TP53 H193R (TCGA Altered: 0.6%; 6 out of 996 samples)
- EFM19
TP53 K132E (TCGA Altered: 0.2%; 2 out of 996 samples)
- CAL851
TP53 R175H (TCGA Altered: 2.1%; 21 out of 996 samples)
- AU565
- HCC1395
- SKBR3
TP53 R248Q (TCGA Altered: 0.4%; 4 out of 996 samples)
- HCC1143
- HCC70
TP53 R248W (TCGA Altered: 0.5%; 5 out of 996 samples)
- HCC2157
- JIMT1
TP53 R273H (TCGA Altered: 1.3%; 13 out of 996 samples)
- MDAMB468
TP53 R273L (TCGA Altered: 0.3%; 3 out of 996 samples)
- HCC38
TP53 R280K (TCGA Altered: 0.2%; 2 out of 996 samples)
- MDAMB231
TP53 R280T (TCGA Altered: 0.2%; 2 out of 996 samples)
- CAMA1
TP53 Y163C (TCGA Altered: 0.3%; 3 out of 996 samples)
- HCC1954
TP53 Y220C (TCGA Altered: 0.7%; 7 out of 996 samples)
- HCC1419
Customized Comparisons
Each project has unique questions. TumorComparer (tumorcomparer.org) facilities customized comparisons of cell line datasets to tumor samples directly from the browser.
Technical Information
This analysis was generated using TumorComparer: 0.99.25. If you use content from this page, please cite Sinha R et al., 2021. DOI: 10.1016/j.crmeth.2021.100039.